How chromnil works
Last updated:chromnil one finds the compounds in a sample that have a biological effect. It separates up to 9 samples side by side on one HPTLC plate, sprays a biological test system over the separated zones and images the result, so each effect shows up exactly where its compound sits.
See which compound causes the effect
Chemical analysis tells you what is in a sample. A bioassay tells you whether the sample has an effect. chromnil does both on one plate, so you can see which compound is responsible.
-
Chemical analysis
What is in the sample?
The compounds are separated and detected one by one, each at its own height.
Not shown: which of them are active.
-
Bioassay
Does the sample have an effect?
The whole sample is tested at once, for example on enzymes, bacteria or cells.
Not shown: which compound causes it.
-
chromnil = HPTLC + planar bioassay
Which compound causes the effect?
The sample is separated first, then the bioassay runs on the same plate. Only the zones with an effect stand out, each where its compound sits.
Both answers from one plate.
An effect can show as a bright, dark or pale zone, depending on the test. The plate in the next section shows the first kind.
-
Bright zoneCells make a fluorescent product where a compound acts on them, as in the yeast estrogen screen.
-
Dark zoneLuminous bacteria stop glowing where a compound is antibacterial or toxic to them.
-
Pale zoneA compound blocks an enzyme, so no colour forms on the otherwise coloured plate.
Five steps on one plate
chromnil one runs the whole analysis from a single program, from applying the samples to imaging the plate. Select a step to see it on one plate carrying reference standards and three samples.
01 Application
Samples are sprayed as narrow bands onto the start line.
An automated applicator ejects nanolitre drops and builds them into narrow bands, areas or spots on the 10 × 10 cm plate: one drop holds about 10 nL, a typical band about 1 µL. Sharp, uniform bands are the prerequisite for well-resolved zones later, so this step decides much of the separation quality and the accuracy of quantification.
chromnil one Holds up to 9 samples and applies a full plate in about ten minutes.
02 Development
A solvent moves through the plate and separates each sample into zones.
The mobile phase (solvent system) is dosed continuously onto the plate edge beside the samples, and the solvent front moves along the plate by capillary action. Each compound partitions between the stationary phase and the mobile phase according to its polarity, so it stops at its own height, its RF. Temperature and humidity govern the activity of the silica gel and with it the separation; the run stops once the front has travelled far enough.
chromnil one Integrated saturation chamber: the instrument doses about 2 mL of mobile phase itself and monitors temperature and humidity.
03 Bioassay
A biological test system is sprayed over the plate and incubated. Active zones become visible.
The nebulizer lays a fine, uniform mist of the test system over the developed plate, for example bacteria, yeast cells or an enzyme. The plate is then incubated at a controlled temperature, for a few minutes to three hours depending on the assay; a substrate often follows in a second round. Zones with an effect stand out from the background, as shown above; all other compounds stay invisible.
chromnil one Nebulizer and incubator are connected modules controlled from the same software; the incubator runs at 30–37 °C.
04 Derivatization
An optional reagent mist, or two in sequence, makes the remaining compounds visible on the same plate.
Many compounds are invisible on the plate. After the bioassay has been recorded, the same nebulizer sprays a reagent over the dried plate; it reacts with the compounds into coloured or fluorescent derivatives, and some reagents need the plate heated afterwards. Several reagents can follow one another, each imaged in turn.
chromnil one The same nebulizer applies bioassay and reagents; the plate heater is built in.
05 Detection
The plate is imaged after each stage, under UV and white light.
The plate is imaged after development, after the bioassay and after each reagent: under UVA 365 nm, UVC 265 nm, visible light and white-light back illumination. These images are the raw data for the evaluation, described in the next section.
chromnil one A 12 MP camera in a light-tight housing, with long exposures for bioluminescence.
From plate image to result
The plate image shows where the zones are and which of them have an effect. The evaluation adds which compound each zone is and how much of it there is, in three steps of the standard image-based HPTLC workflow.
-
Plate image
Locate the zones
The camera image shows every track. Each zone gets its RF: the distance it travelled (a) divided by the distance of the solvent front (b). Under the same conditions a compound always lands at the same RF, so a zone at the height of a standard is that compound.
-
Densitogram
Measure the signal
Each track is scanned along its length. Every zone becomes a peak at its RF, and the area under the peak is integrated.
-
Calibration
Quantify
Standards with known amounts run on the same plate and give a calibration line. The sample’s peak area is read off that line as an amount.
Try it: evaluate a sample
Pick a sample from the example plate in the steps. The strip is its track, the curve beside it shows how strongly each zone appears: grey in the chemical image, teal in the bioassay. The table names each zone after the standard at the same height, gives its amount compared with that standard and how strong its effect is.
| Zone | Compound | Amount vs. standard | Effect |
|---|
Results on par with status quo HPTLC instruments
The figures come from the open-source 2LabsToGo system that chromnil one is developed from, measured side by side with status quo HPTLC instruments on ergot alkaloids in whole rye [1].
| Result | 2LabsToGo | Status quo |
|---|---|---|
| Same sample, same signalRepeatability, %RSD, lower is better | 4.1% | 4.8% |
| Twice the amount, twice the signalLinearity, R², higher is better | 0.9918 | 0.9890 |
| Small amounts still foundDetection limit per zone, lower is better | 0.4 ng | 0.5 ng |
With bioassays, too: the 2LabsToGo-Eco reached a repeatability of 2.5–6.0% RSD with the SOS-Umu-C bioassay and two reagents on the same plate, comparable to about ten commercial devices in two laboratories [2].
Study data: plate images and calibration (Fig. 2)Both instruments side by side, from the published study
Signal by amount applied
- 2LabsToGoR² 0.9918
- Status quoR² 0.9890
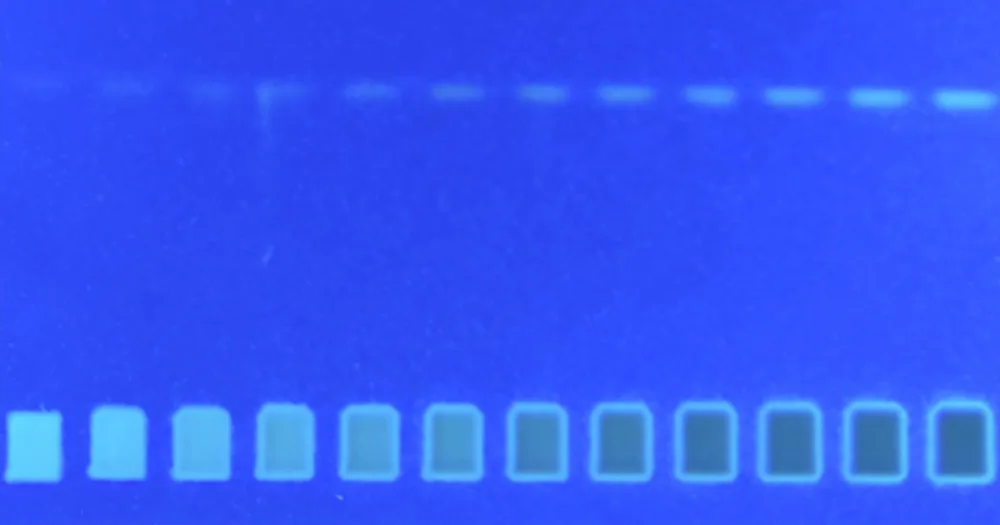
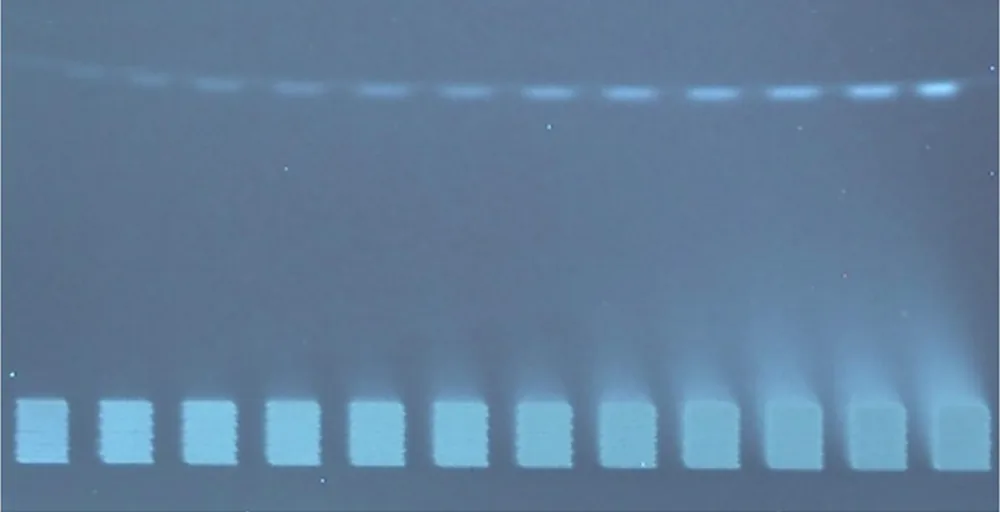
Repeatability 4.1% RSD · status quo 4.8% (deviation across n = 10 · 3.3 ng each)
Method conditions of the ergot alkaloid study
- System
- 2LabsToGo (2022 hardware [3]) versus ATS 4, HDC, Plate Heater, Immersion Device III and TLC Visualizer 2
- Analyte
- Ergocristine (EC), applied as 4 mm × 5 mm area
- Plate
- HPTLC silica gel 60 NH₂
- Mobile phase
- Ethanol – toluene 4:1 (V/V), 2 mL (2LabsToGo) · 3 mL (status quo)
- Migration
- 40 mm, horizontal development
- Detection
- 255 nm (2LabsToGo) · 254 nm (status quo TLC Visualizer 2)
- Enhancement
- n-Hexane – paraffin oil 2:1 (V/V)
- Repeatability
- 10 applications of 10.0 µL
- Linearity
- 12 amounts from 0.5 to 8.3 ng
- Detection limit
- LOD by the calibration curve method; LOQ 1.2 ng (2LabsToGo) against 1.4 ng
- Recovery
- Rye spiked at the EU limit of 500 µg/kg, recovered close to 100 %
- Evaluation
- quanTLC (open source) [4]
From open research to a routine instrument
The method comes from Prof. Gertrud Morlock's group at Justus Liebig University Giessen, which has developed open-source HPTLC instruments since 2010, with planar bioassays since 2021. The latest, the 2LabsToGo-Eco [2], is the basis of chromnil one; its hardware, firmware and software are published under open licences.
- 2010 Office chromatography Printing samples onto HPTLC plates with office peripherals, Justus Liebig University Giessen.
- 2018 OCLab The first all-in-one open-source HPTLC device: under 3 kg, nine times less bench space.
- 2021 LabToGo Plate heating, UV imaging and the first bioassay in the all-in-one device.
- 2022 2LabsToGo Chromatography lab and bioassay lab in one 6.8 kg system.
- 2025 2LabsToGo-Eco Autosampler, nebulizer, mini-incubator, new imaging and mainboard.
- 2026 Humidity control Relative humidity regulated inside the instrument; software on current Raspberry Pi and Debian.
- 2027 chromnil one Engineered for routine laboratory work, delivered ready to use and supported.
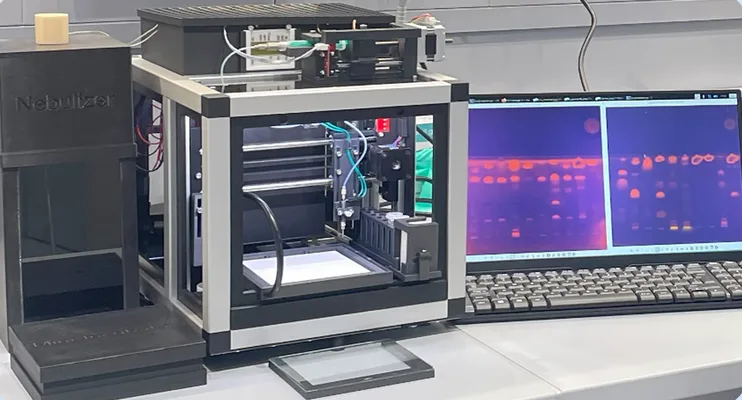
As an academic instrument, it has to be built by its users: they order the parts, manufacture, assemble, calibrate, repair and update the system. Most laboratories have neither the staff, the equipment nor the engineering skills for that.
chromnil one turns this research into an instrument for routine laboratory work: the same method, made more robust and easier to use by chromnil's own engineering. The table shows what changes for the laboratory.
| 2LabsToGo-Eco | chromnil one | |
|---|---|---|
| Method | HPTLC with planar bioassays, five steps | The same |
| Development | Academic research project | Engineered for routine laboratory work |
| Delivery | Build it yourself | Assembled and configured |
| Calibration | By the user | Done before delivery |
| Software | Maintained by the user | Regular automated updates |
| Service | Repairs by the user | Fast, reliable system service |
| Support | Community | Training and continuous support |
References
- [1]Jakob K, Schwack W, Morlock GE. All-in-one 2LabsToGo system for analysis of ergot alkaloids in whole rye. Food Chemistry 453 (2024) 139593. doi.org (opens in new tab)
- [2]Romero MCO, Jakob K, Schmidt J, Nimmerfroh T, Schwack W, Morlock GE. Consolidating two laboratories into the most sustainable lab of the future: 2LabsToGo-Eco. Analytica Chimica Acta 1367 (2025) 344103. doi.org (opens in new tab)
- [3]Sing L, Schwack W, Göttsche R, Morlock GE. 2LabsToGo: Recipe for building your own chromatography equipment including biological assay and effect detection. Analytical Chemistry 94 (2022) 14554–14564. doi.org (opens in new tab)
- [4]Fichou D, Morlock GE. quanTLC, an online open-source solution for videodensitometric quantification. Journal of Chromatography A 1560 (2018) 78–81. doi.org (opens in new tab)
chromnil one in your laboratory
See the modules and specifications on the instrument page, or talk to us about your samples and assays.